We recently rebuilt the new Live Coverage experience for the Wall Street Journal. I had pushed for this for years. As someone who really loves a blog, the old presentation for our live coverage really bugged me. The layout of the page had struggled to properly convey the immediacy of the reporting, or to even feel live. The page heading itself was about 2/3rds of the page. Or well passed the viewport height if there was an image. The first post looked small and insignificant, sandwiched between a Top Posts widget and an ad. This particular product was begging for an update.
In summer 2019, the newsroom started looking ahead to the reporting of the 2020 U.S. Presidential Election primaries, Live Coverage finally landed on the product roadmap. I was ready. And the timing happened to be perfect for me, as well. I had just moved from working on the reader-facing WSJ products to the newsroom tools team. This meant that I was well positioned to design the new Live Coverage page, and to also design the new publishing tool for it.
It's rare for a custom CMS to be designed along with a new publishing product. It's usually either something like a Wordpress install to hack together what the front-end needs, or it's a front-end designed around the limitations of the CMS. This is especially true for products in legacy media as old as the WSJ. Roadmaps don't often come together like this with newsroom needs timed so perfectly with engineering availability. The Live Coverage product fell right into this sweet spot.
I made sure to take full advantage of it. Because we were prioritizing a mobile-first experience, the tool could present a new post beside a stream of what's already been posted. A reporter or editor can write inside a high fidelity WYSIWYG field while also having what's been published right in view.

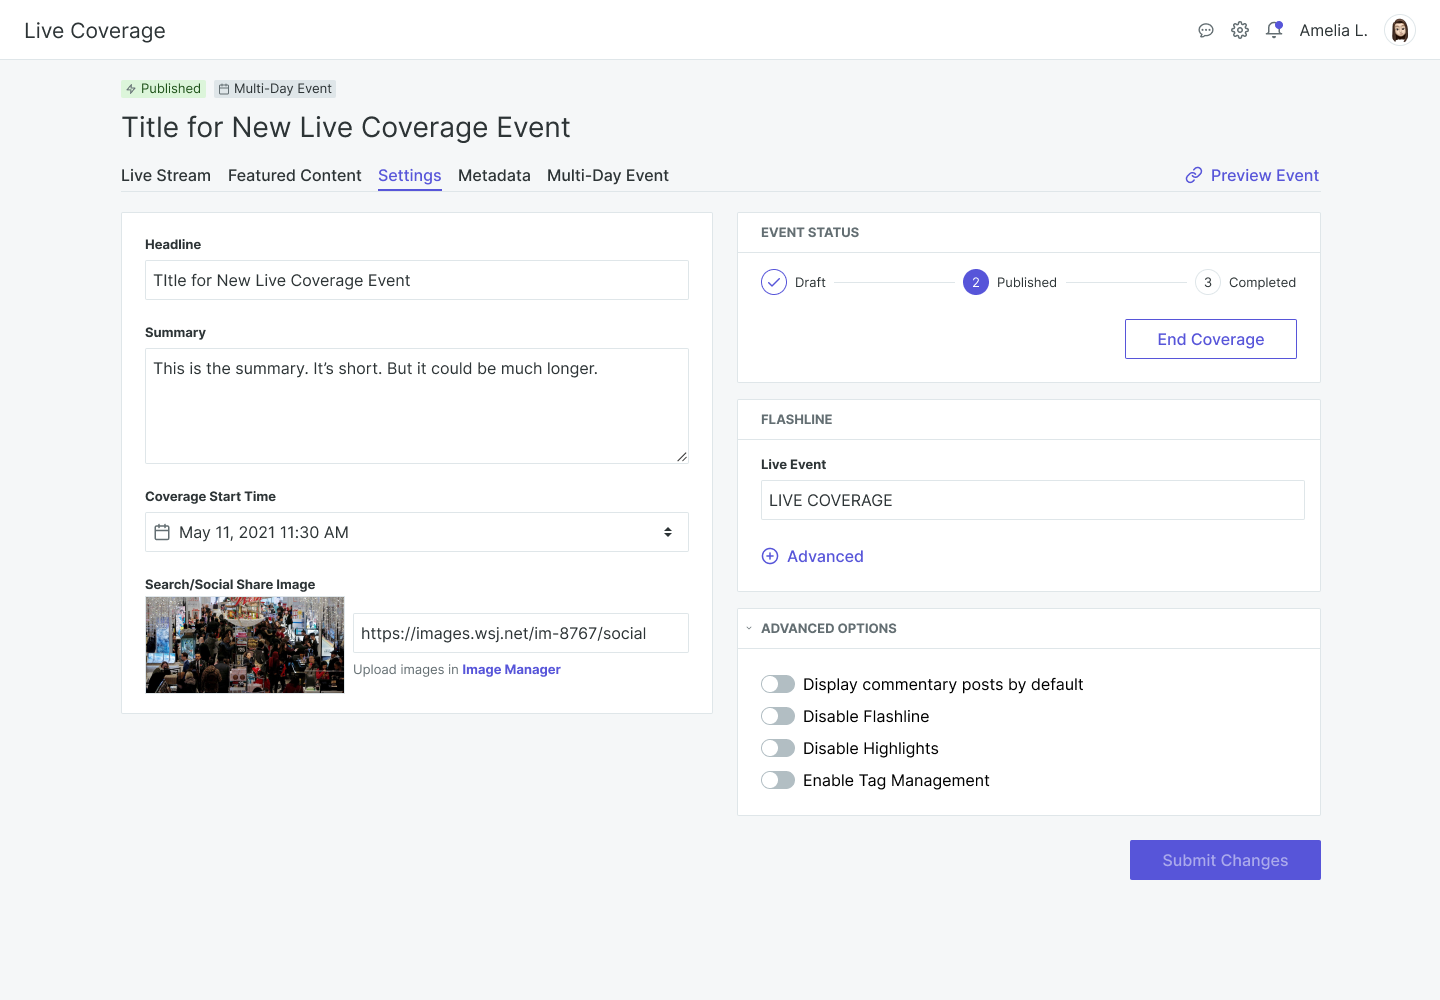
We also introduced a couple brand new concepts to our Live Coverage reporting: a Featured Post position for presenting highly valuable context for the content stream below, and a Primary Media position for sharing a map, chart, or image that is integral to the event. Here is the page in the tool for posting to these locations, with little illustrations for reminding editors where that content will appear.

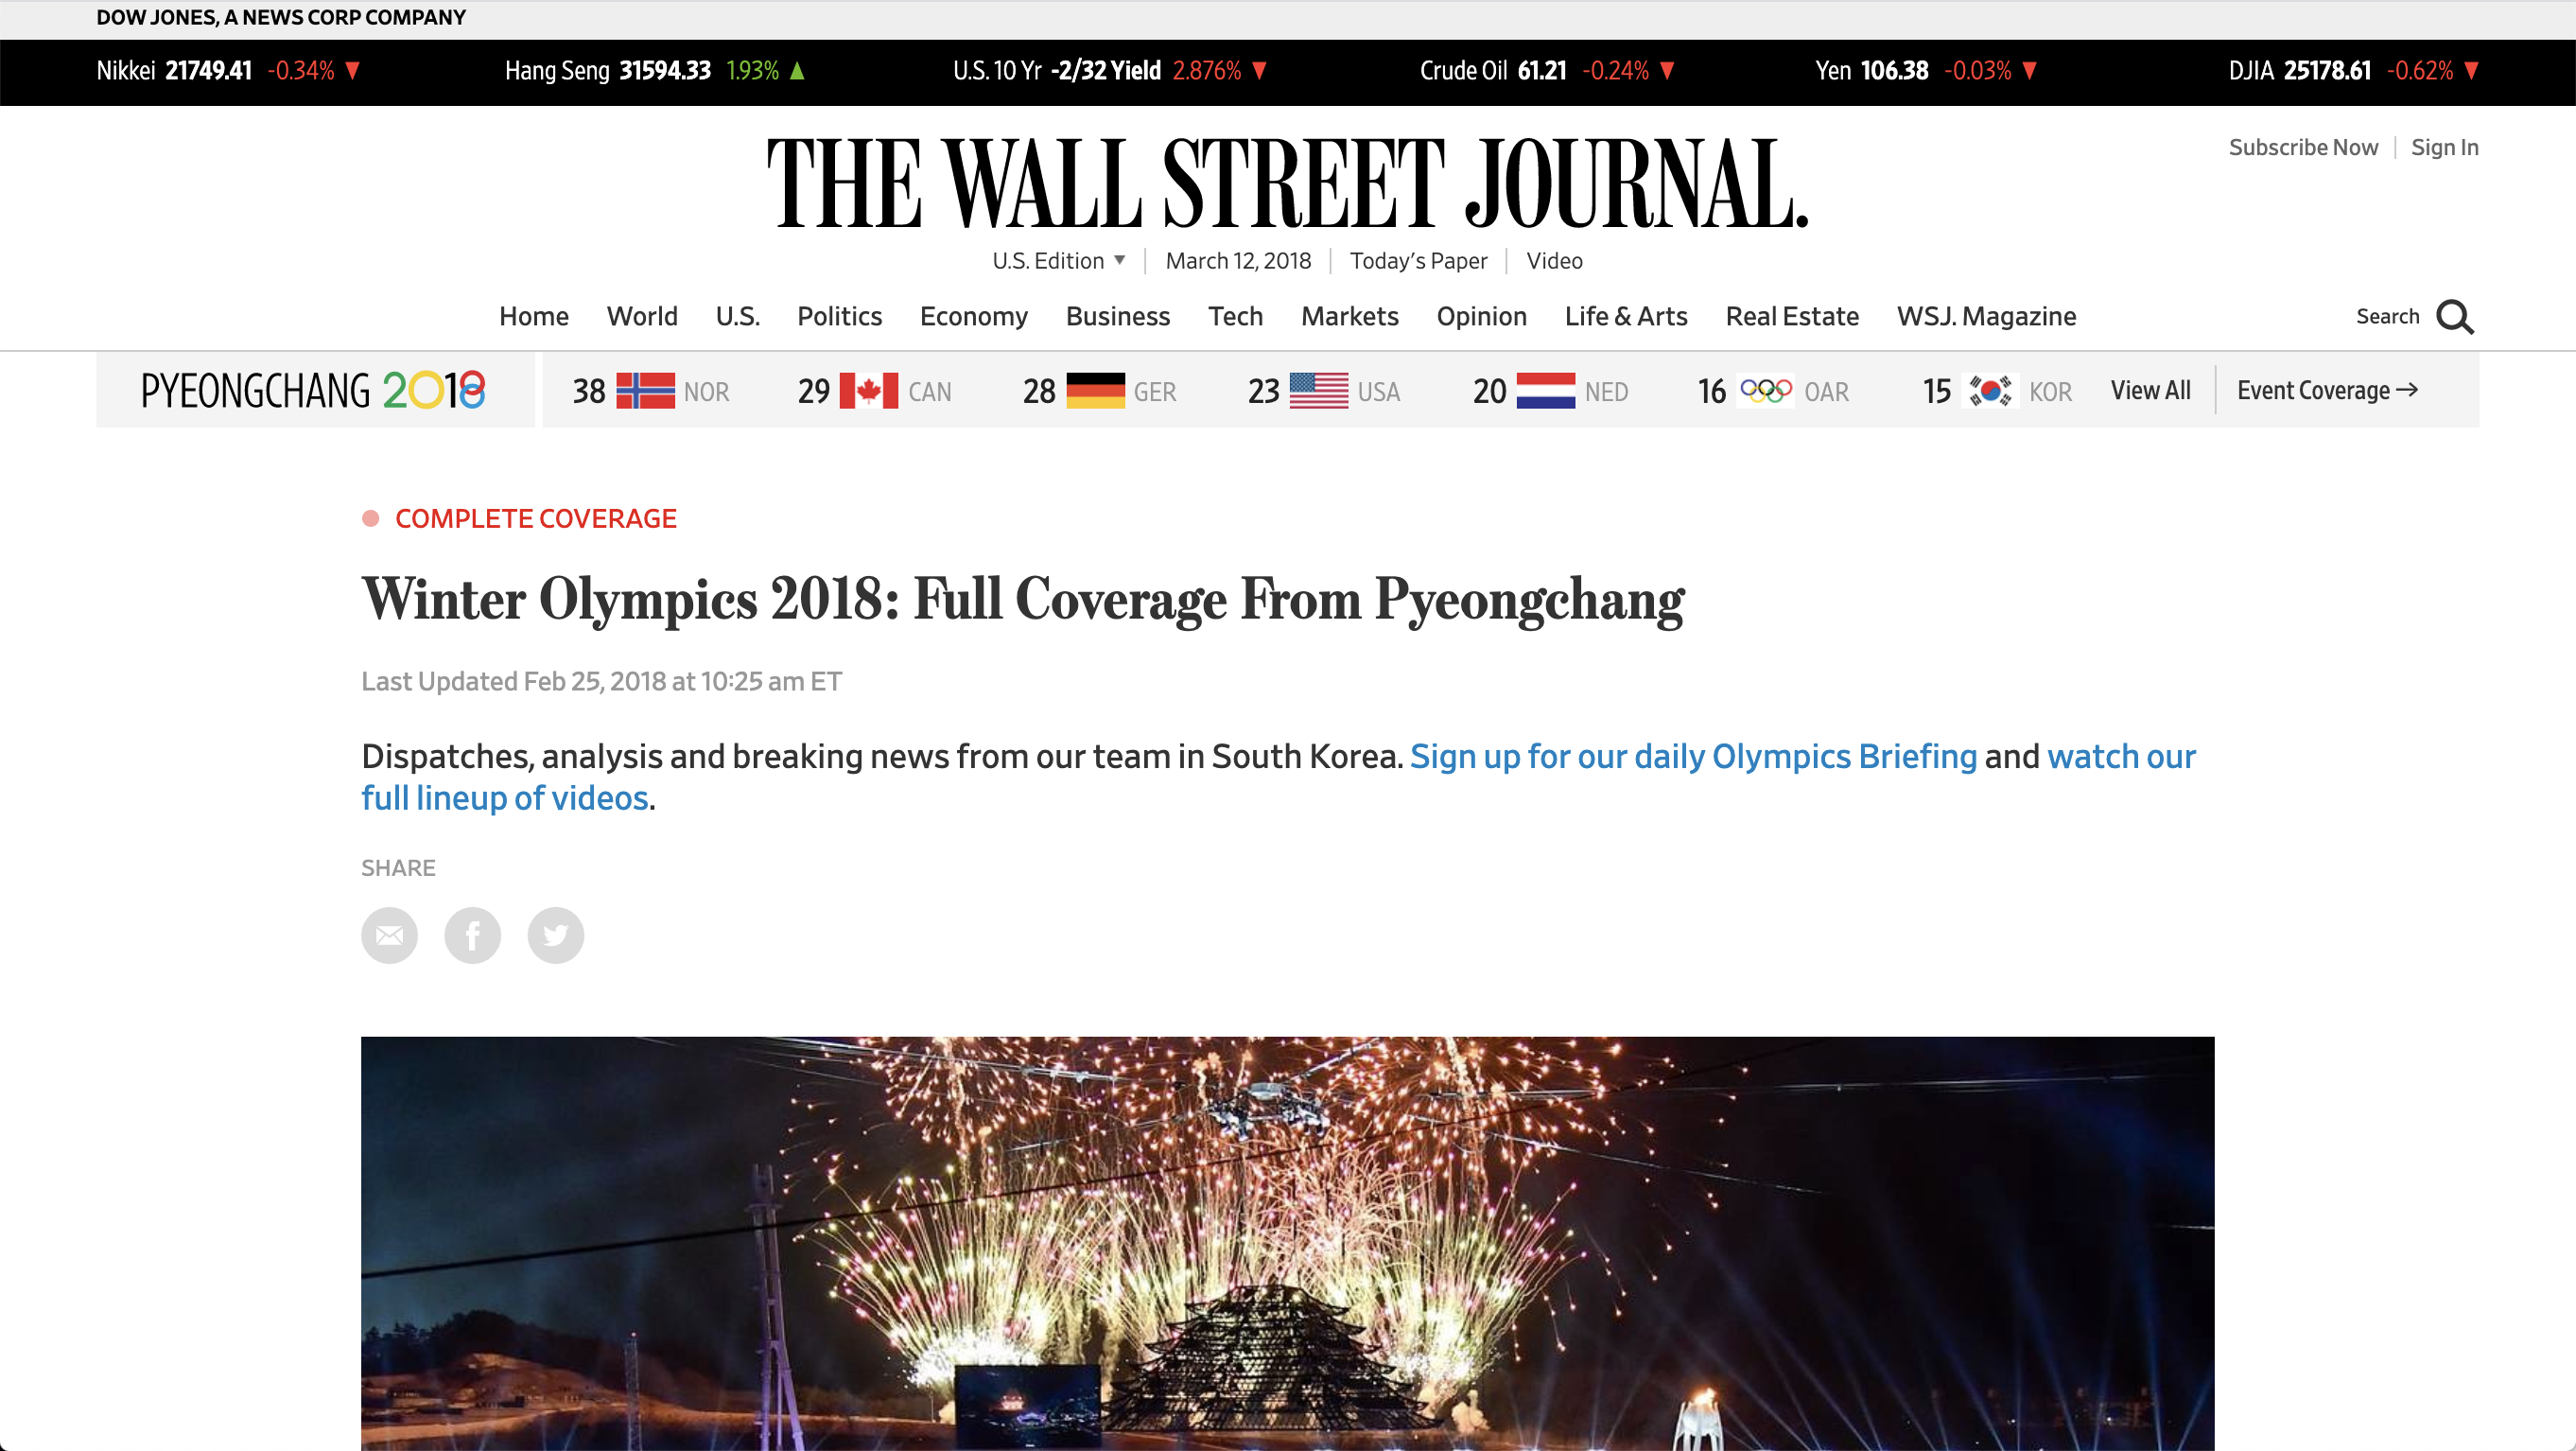
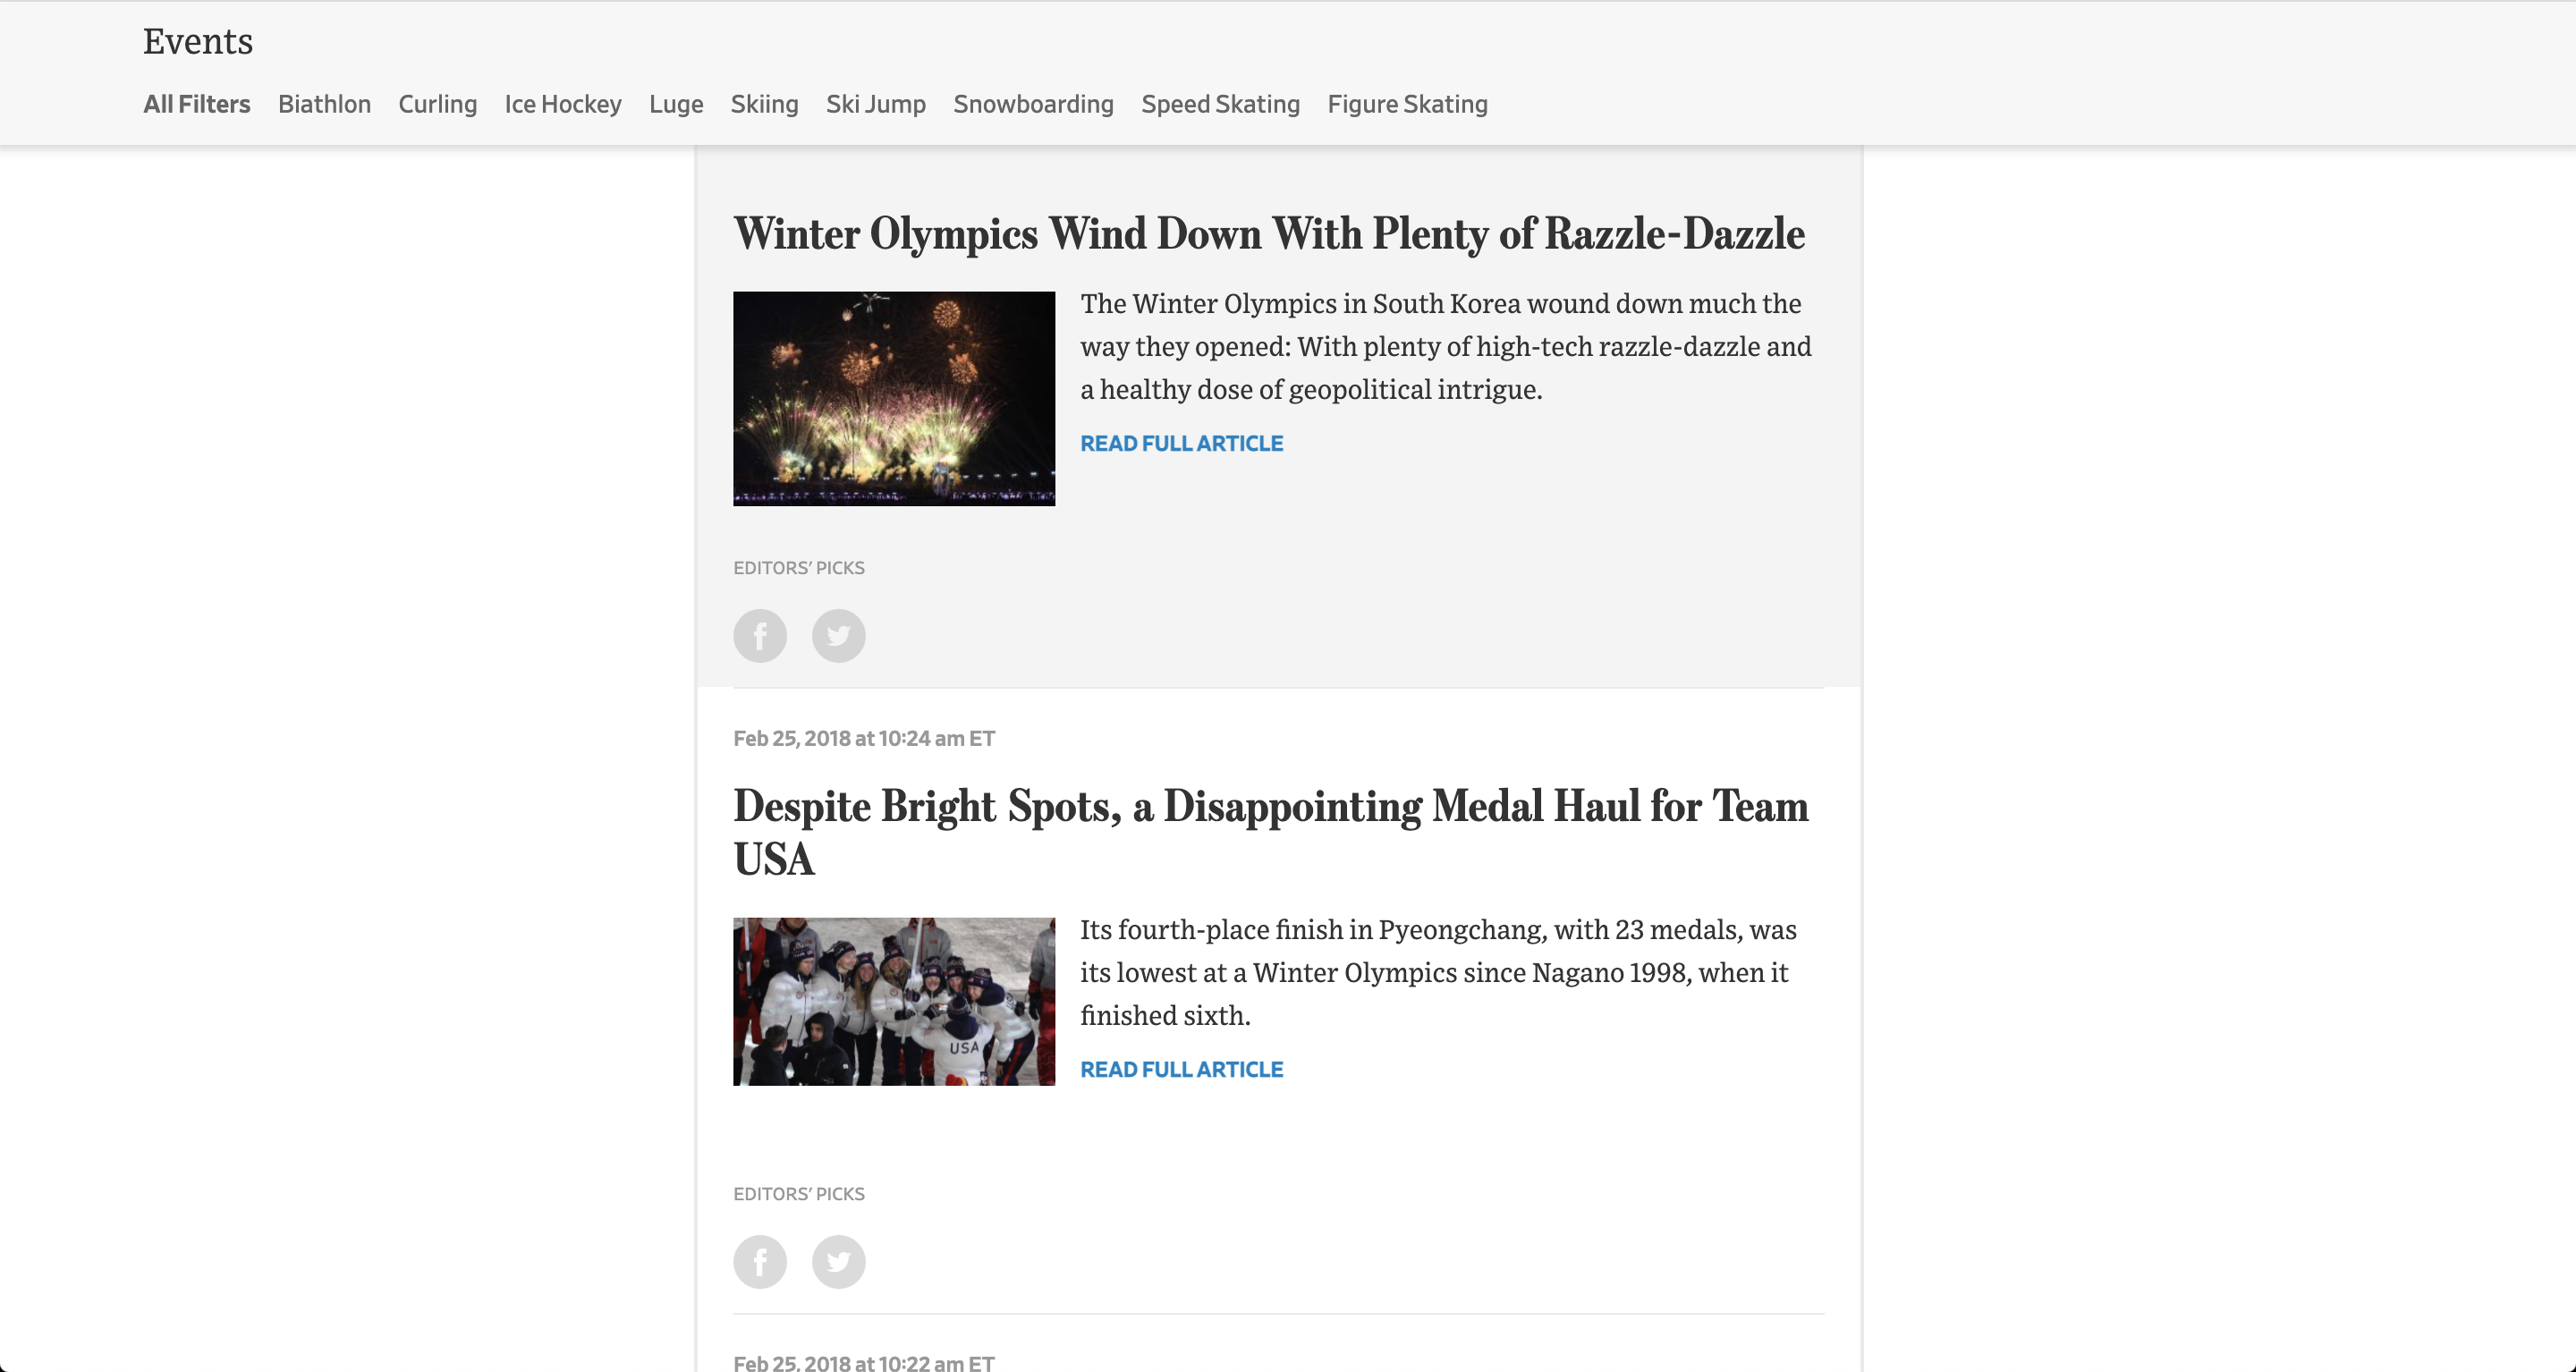
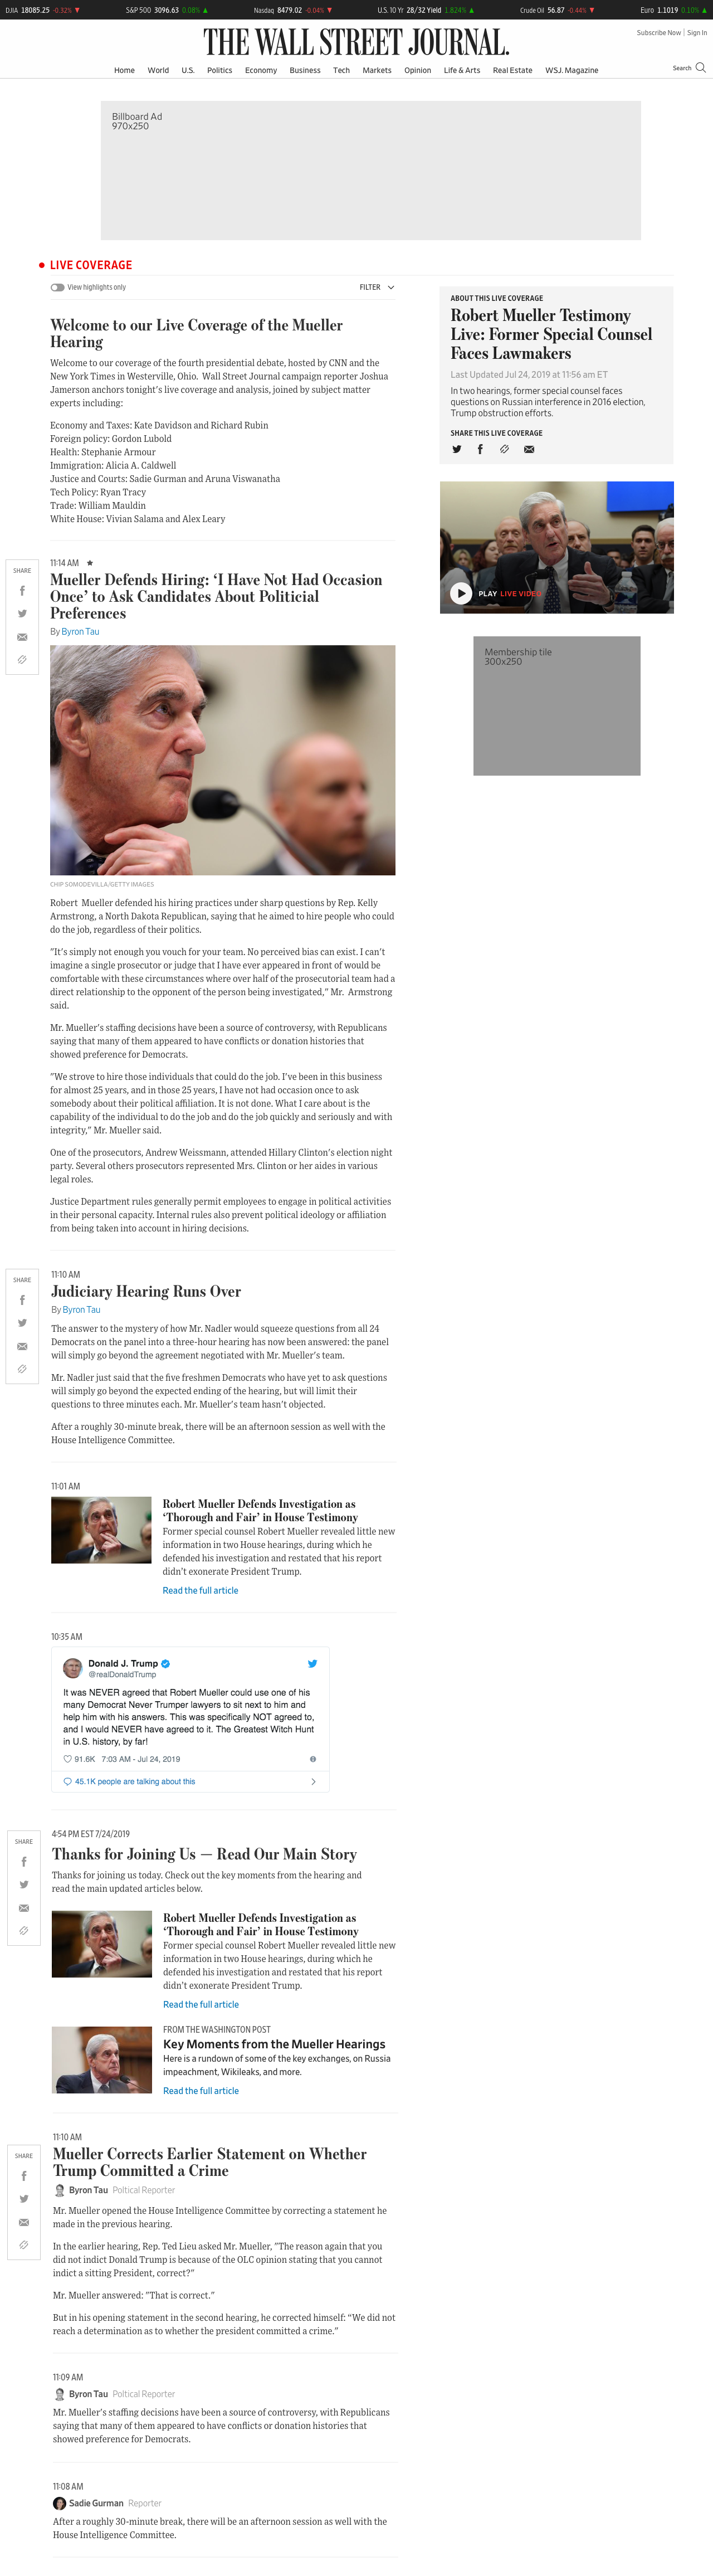
And here is a design for a Live Coverage event, with everything in place. You can see that the content hierarchy establishes priority in the order we wanted to stress. The most recent post is top left, and about 2/3rds of the page width, large and prominent. A Featured Post takes that place if there is important context editors want to stress. The page-level meta info is packed into a small box on the right, with Primary Media content just below.
Another brand new feature we built into the tool was the ability to have Pre- and Post-Coverage views of the page. For SEO and link-sharing purposes it helps to have a live URL ready to go well before the event begins, and the page itself makes clear when the event coverage is going to start. When the event is over, the page displays that explicitly, as well.

The tool works really well. We've had a great response from our editors. What's even better than praise, though, is seeing our Live Coverage reporting increase in amount of coverage posted, and a much greater frequency of Live Coverage events being created. The icing on the cake is hearing that for the period between the 2020 election and Biden's inauguration, the Live Coverage pages were getting page views rivaling those of the WSJ.com homepage. Not only that, but the live coverage page views for the first three weeks of 2021 have already beat the entire amount of page views for live coverage in all of 2019. It's absolutely time to call this project a huge success. I couldn't be prouder to have worked on it, nor to have been a part of the great team who brought it to life.
More Views